Abstract: In this paper we take a look at the health of a typical enterprise network via a new metric based on the fraction of useful flows generated by endhosts. Flows considered non-useful are those that explicitly fail or else do not elicit a response from the intended destination. Examining traces collected from a large number of mobile hosts in an enterprise network, we find that about 34% of the flows are not useful. Through our study that combines data analysis and ongoing interactions with our IT department, we learn that these non-useful flows arise from several causes. Our mobile hosts frequently change environments, by either moving in and out of the corporate environment, or by switching the point and means of attachment to the corporate network. We find that many of the failures occur due to the hosts’ lack of environment awareness, which results in attempts to discover services that are not present in all environments. Other causes include misconfiguration, unnecessary broadcast traffic, and excessive connection retries. Understanding this ever present noise in endhost communication is important for a variety of reasons including the fact that it complicates anomaly detection design and wastes resources, the latter of which is particularly crucial for wireless and mobile environments. Finally, we discuss possible means to design applications and services that can significantly improve the health of the network.
Enterprise networks today are walled gardens that sometimes rival the complexity of the larger Internet. Enterprises can, and generally do, impose policies on the employee’s host machines to provide protection against rogue entities and to control network traffic, for instance, stringent policies relating to software patching and updating are enforced to keep hosts protected. Additionally, in our own network, users are prohibited from installing a number of blacklisted programs that are considered potentially detrimental to the network or a security risk. Other enterprises take more draconian measures, locking down the hosts so that users cannot install any new software after being configured. Given this level of policing, one would expect the traffic generated by user endhosts to be well behaved and easily analyzable. As we clearly demonstrate in this paper, this is far from the case.
This disconnect exists for a number of reasons, starting from today’s applications being very complex and hard to diagnose, coupled with a highly distributed infrastructure exacerbated by shrinking budgets of IT departments whose general motto may well be “if it ain’t broke, don’t fix it”. The end-result is an ailing network with poor diagnostic properties; small problems go unnoticed and accumulate over time, sapping away network resources.
In this paper, we take an early look at traffic traces collected from a large number of enterprise endhosts, specifically with an eye toward quantifying, and understanding, traffic at the edge of the enterprise network. One of the contributions of this paper is a new metric which we take to capture the “health” of an enterprise network from the perspective of the endhosts at the edge of the enterprise. We define health as the fraction of observed flows that are useful. A flow is deemed useful if it successfully contacts the intended destination application; and non-useful if the connection attempt times out, or the flow is made to destination applications that are not alive or are unreachable. Clearly, non-useful flows are symptomatic of misconfigurations, stale information, or some other underlying malady.
Our definition of health is simplistic, nevertheless we found examining enterprise traffic through this lens of useful (and non-useful) flows well suited to identifying suboptimal design in both applications and the architecture. A number of in-network mechanisms ranging from NATs and firewalls, to intrusion detection systems [14] and application dependency extraction [4] operate at the granularity of flows. Our definition of health captures, at least to the first order, the noise such mechanisms must contend with.
Identifying and quantifying this ever present noise at the edge of the enterprise network is important for several reasons. The first stems from the difficulty of designing endhost based anomaly detectors in the presence of unhealthy activity that may be benign. Failed connections have been used as an indicator of anomalous network behavior (e.g., scanning) [7]. An inherent assumption behind such approaches is that most systems should be able to contact their intended destination most of the time in well engineered networks. We observed in our traces that a third of all outgoing connections seem to fail. This high level of noise has the effect of drowning out existing anomalies and other symptoms of poor performance.
A secondary motivation for studying the health of the enterprise edge is to understand the inherent inefficiencies. For instance, NATs and firewalls may be consuming a third more resources than necessary for keeping track of flows. And in wireless environments, which are gradually becoming ubiquitous both inside the enterprise and as a means of connecting to the enterprise from outside, failed flows may be causing unnecessary channel contention [16] leading to poor application layer performance, and increased costs under metered pricing (e.g. on cellular networks).
Overall our contributions as are follows. First we analyze traffic traces collected from a large population of enterprise endhosts and quantify their health. We uncover that the level of health hovers between 60 to 70% on an ongoing basis. We study the traffic from various perspectives, including temporal, application based, changes in environment, protocol behavior and failure types. We find that most failures can be attributed to a small set of chatty applications, and thus feel optimistic about improving the health of of the enterprise network. Second, we quantify the problem of lack of environment awareness that we find to be a big contributor in our analysis. Roughly 77% of observed failures occur within a minute of the endhost switching between networks. Such behavior can have grave consequences in terms of information leakage when enterprise laptops transition from inside to outside the corporate environment. Third, in our efforts to understand the causes behind the high level of failures observed, we taxonomize our failures into three groups: persistent connection retries, service discovery and vulnerability testing. We believe that much of the service discovery activities are potentially redundant and designing a more cohesive network architecture provides opportunities to amortize the cost of service discovery across multiple applications. Finally we suggest some coping strategies and show that some of the waste can be remedied in a straightforward fashion if awareness of the problem were to be spread, while some requires more involved network architecture improvements, and some simply requires acceptance as part of normal enterprise traffic.
Traditional network trace collection efforts have been “network centric”—traces are gathered at routers or other aggregation points. Inferring the cause of failures from such traces is problematic for two reasons: first, addresses are fairly dynamic making tracking users difficult, and more importantly, second, today’s enterprise network is very mobile as users move in and out of the network. Observing in-network traffic does not capture network transitions, thus providing a very limited snapshot of endhosts’ behavior. Studying health as it appears from the perspective of the endhost, requires traces collected on the endhost itself.
During February of 2007, we collected data from over 350 volunteering employees, spread across a number of sites. We collected all packet headers and 150 bytes of the payload for all traffic at the endhost across any active network interface. Of this set, 95% are mobile hosts and utilize different interfaces at different times; the remaining are desktops. For the mobile hosts, the traces include activity when the host was outside the enterprise—at coffee shops, home, airports, etc.
Each trace file is annotated with coarse grained user location: internal, VPN and external, as well as a unique per-user identifier. The traffic was captured with WinPcap that was restarted upon any change in environment, address or interface. Importantly, all the hosts that participated in the study ran an up-to-date version of Windows XP SP2. In total, the traces yielded 31M flows.
Our analysis utilizes flow level data. The collected packet traces were post processed with BRO [14] which performed the flow reassembly. In addition to tagging flows as being inbound or outbound from the endhost, BRO summarizes the “connection state” of how the flow terminated. Unless mentioned otherwise, we consider both inbound and outbound flows for our analysis. For all the applications that we can explicitly mention in this paper, the identification was done by consulting a “list of known ports” that is maintained by the IT department.
We classify individual flows as being useful or non-useful. The former class consists of flows that have been able to elicit a response from the destination. This includes TCP flows that complete the 3-way handshake and also UDP flows that see packets in both directions, regardless of the number of bytes exchanged or how the flow was (finally) terminated. Thus, we consider a TCP connection as being useful even if it was closed by a RST (as long as the handshake was first completed). Successful flows correspond to BRO flags other than S0, REJ, RSTOS0 (see [1] for details) while failed flows correspond to these three flags.
Classifying flows at the transport layer (versus at the application layer) introduces artifacts: (i) flows that succeed at the transport layer but fail at the application layer (e.g. an incorrect login on a webpage) are considered useful in our classification; (ii) unidirectional UDP flows, for instance, network level broadcasts which elicit responses from a different address (e.g. NetBios), are tagged as failed. We manually identified broadcast traffic and analyzed the most egregious of applications for unidirectional flows; unless mentioned otherwise, we omit such flows in our analysis since we cannot determine if they succeeded. Correcting for flows that fail at the application layer is considerably harder since we lack application level knowledge. Even if one could attempt doing this for well known applications (http, smtp, etc), many enterprise applications are proprietary and create considerable hurdles for doing so.
As to the question of to what extent our results can be generalized to other enterprise networks, we shared our findings with the IT department and relied on their expertise in network design and operations. A large fraction of failures are endemic to software that, we learned, is typical in many enterprises, such as the Windows OS, the anti-virus software, and the software-patching service. Also, given the size and complexity of today’s enterprise networks, it is reasonable to expect them to be designed and configured following well tested “templates” and best common practices; for instance, a DMZ, a VPN, different internal and external DNS namespaces, a (small number of) homogeneous software stacks, and so on. We consequently believe that our results apply, at least in part, to other typical large enterprises that share the same culture of allowing employees semi-autonomous control over their laptops (save perhaps for a small set of prohibited activities and applications).
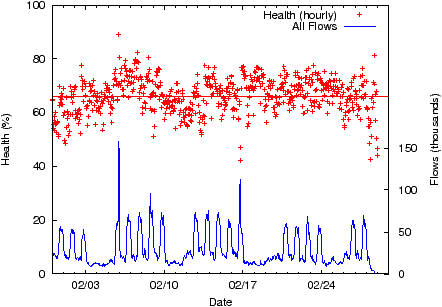
Computed over the entire trace the health of our enterprise network from the endhost’s perspective, defined earlier as the fraction of successful flows, is 66%, suggesting that there is much room for improvement. In this section we analyze the factors on which health depends including time of day, user location and activity, and applications.
Figure 1 plots the average hourly network health during the course of our trace and also the time series of flow volume seen. While noisy, the health hovers around (a low) 66% despite very pronounced diurnal and work-week patterns seen in the flow volume. We were very surprised to learn that this low number does not really translate to users complaining about poor performance. IT personnel explained that most users are often unaware of what causes sluggish performance—network errors and bloated apps being two of a very large number of probable causes—and consequently come to passively expect mediocre performance or else feel that their experience is “adequate for the purpose”. One redeeming observation, however, is that at least for web traffic (ports 80, 88, 443, 8080) there is a positive correlation between health and activity (not shown in the figure); failure rates for these ports are lower during working hours.
We find the user’s environment has a noticeable impact on the rate of failures: 34% of flows fail when users are connected directly to the enterprise network (wired or wireless), compared to a staggering 57% when users are logged in through the VPN. In contrast, 17% fail when users are outside and not connected to the VPN. We believe that these numbers would be lower in other enterprise networks that have stricter “lockdown” policies for endhosts. In our own network, users are free to install arbitrary applications1 and consequently, the numbers we see are somewhat to be expected.
Looking only at outgoing connections, we see a very interesting statistic: a significant fraction (77%) of these failures occur within the first minute of the user acquiring a new IP address. The number rises to 90% within the first four minutes. Of the flows failing in the first minute, 87% are to destinations that the user had previously successfully contacted a few minutes earlier (8 and a half minutes in the median case). This is consistent with applications attempting to reestablish connections broken by the user moving to a different network environment, and failing to do so when the reachability of the new network differs from that of the previous network2.
Application From Internal From VPN Anti-Virus Update 3191 33 Directory Service 2940 0 Unknown (port 5499) 2451 57 DNS 1760 97 Windows RPC 688 129 Web 633 255 Other 2029 215 Total 13692 786 Table 1: Number of unique instances where an application leaked potentially sensitive IP address information when transitioning from internal and VPN environments to external networks.
This behavior of attempting to reestablish connections can leak sensitive information in external networks. For instance, 1969 internal IP address and port pairs were leaked to external networks. In addition, over 63K DNS requests failed in external environments, and although we do not have the query payload, it is highly likely that several of these requests leaked internal hostnames. The numbers are cause for concern as, in many cases, applications intended for internal use do not authenticate the server because the network is assumed to be trusted; consequently, attackers on external networks can masquerade as trusted internal services by spoofing IP addresses or DNS responses, and collect user credentials or launch man-in-the-middle attacks. Table 1 tabulates the number of unique instances where an application leaked at least an internal IP address and port information when transitioning from the internal network or VPN to an external network.
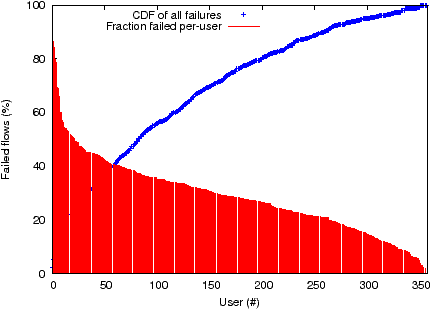
The fraction of failures varies widely for individual users as illustrated in Figure 2. The figure plots users ranked in decreasing order of the fraction of failed flows to/from their endhost; the CDF (solid line) in the same figure tracks the contribution of specific users to the total failures seen in the traces. Thus, the first user sees 84% failures personally, which accounts for about 6.7% of total failures. As is clear in the figure, the top 1% users are responsible for a disproportionate 15% of all failures, which we attribute to misconfigured applications as explained below.
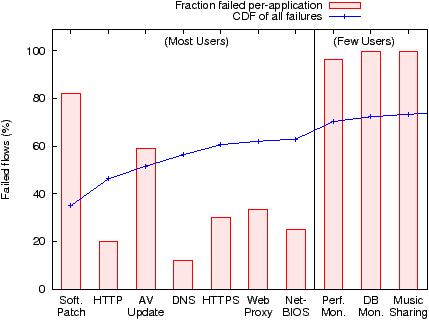
Turning our attention now to applications we find that ten applications are responsible for 73% of all failures observed. In Figure 3, we quantify the failure rates associated with these ten applications. Note that there are two distinct classes of applications involved: applications used by the entire population, such as infrastructure apps, are grouped to the left, and applications installed by a very small number of users (<20 in our trace population) are grouped to the right (these are applications explicitly installed by the users). We believe both classes deserve discussion as the former reflects inefficiencies experienced by the user population as a whole, and the latter reflects applications that affect the network most severely.
The software patching service is the most egregious application in the “popular” class. The high incidence of failures is attributed to its unique service-discovery design: clients periodically discover the closest patch distribution server by launching hop-limited probes to all patch servers (numbering in the hundreds); this results in a large number of flows, most of which fail before reaching the (final) destination. Furthermore, this application is environment agnostic and continues to behave aggressively when outside the enterprise, resulting in even more failures. A lack of environmental awareness is also to blame for the high failure rates seen by the anti-virus application which is configured to periodically poll a server for updated signatures and policies.
Among the failing applications used by a small number of users are two monitoring applications, and a music streaming application. The first application monitors the performance of enterprise servers (load, processes, alerts, etc.); when shown these failures the operational IT group believed that the pattern was suggestive of an incorrectly configured server that the endhost was trying to connect to. The second application monitors the performance of database servers and appears to be similarly misconfigured. The third is a music streaming application that fails while attempting to punch through firewalls and proxies by improperly masquerading as SSL and VPN traffic. While these applications are isolated instances in our environment, in general we believe that, misconfigurations and policy violations by a small number of users are worth investigating as they can significantly affect the overall health of an enterprise network.
In this section we introduce a taxonomy of failures which hint at the underlying causes for the poor health that we observe. Building on the taxonomy, we suggest a few incremental changes to applications that can serve to reduce the high incidence of failures.
The majority of failures can be attributed to applications that persistently initiate new flows to a host despite repeated failures. The flows fail either because the application is misconfigured, or because the destination is temporarily unreachable, potentially due to the user connecting from the wrong environment. Indeed the application contributing 8% of all failures inside the enterprise network is the misconfigured performance monitoring application mentioned earlier.
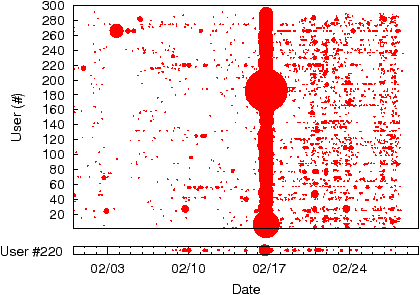
Figure 4 presents a detailed look at outbound flows for the software patching service. The figure plots failed flows for each user as a function of time; the size of each circle is proportional to the number flows failing in that hour with the largest circle representing 1583 failures. A horizontal slice corresponding to a particular user is illustrated at the bottom for clarity. The figure exposes a service outage on 2/17 and continuing degraded performance in the subsequent days, which we confirmed to be the result of significant added load on the service during the noted days. At their peak, hosts relentlessly initiated on average 11 failed flows per minute during the one-day outage — a scenario where adaptive retry intervals would have reduced the load on the service and the failures observed.
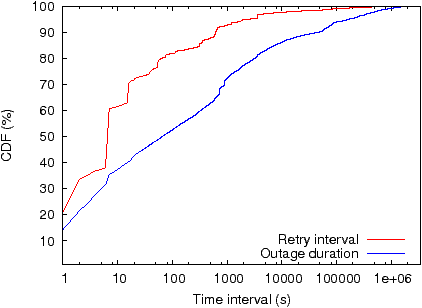
In Figure 5 we plot the CDF of outages, defined as the time between successful flows to the same destination, across all users and applications (the bottom curve). The line is curiously linear across six orders of magnitude. We also plot the CDF of retry intervals (the top curve); the ten most failing applications listed in Figure 3 account for 82% of these persistent retries, with the software-patching app accounting for the jump at 6s. The figure exposes a fundamental disconnect between the need for retrying, and the retry interval: 20% of outages are transient and disappear within two seconds, however, beyond this, destinations experience what we term “outage inertia” where the longer the outage has lasted, the longer it is expected to continue to last. Retry intervals, on the other hand, tend to be static, typically lasting less than 15 seconds, which for long outages results in a large number of failures. 80% of retries are within 1 minute of a previous failure, whereas the 80th percentile outage lasted 53 minutes. Dynamically picking the interval before retrying a flow at the application level, perhaps performing exponential backoff, would be one possible approach to reducing the number of failures while still closely tracking the outage duration.
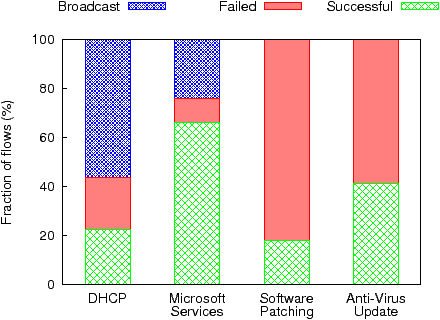
Applications use several ad hoc mechanisms for self configuration and service discovery. In Figure 6 we plot the distribution of traffic for four illustrative applications. The first is DHCP that attempts to reach a previously cached server, failing which it relies on broadcast to discover the configuration server. The second is Microsoft’s NetBIOS protocol, which uses broadcast to elect a leader endhost that then assists other nearby endhosts in discovering resources, potentially resulting in a flurry of failures and broadcast traffic when the leader switches networks. The third is the software patching service that relies heavily on periodic hop-limited probes, and the fourth is the anti-virus service that periodically polls the server. Each application, in essence, duplicates service discovery, some more noisily than others, by operating independently rather than amortizing their efforts by collaborating.
Vulnerability testing, where a host designated by IT scans for vulnerabilities in endhosts on a routine basis, results in a class of “useful” failures, something that we did not originally anticipate. Such services are responsible for adding a uniform number of failures across a wide range of otherwise unused ports (e.g. telnet, finger, ident). 8.5% of failures for flows inbound into the endhost (4.8% of all failures in our enterprise) can be attributed to vulnerability testing.
Based on our experience in this paper, we identify two key areas in which applications can be modified incrementally to yield significant savings. First, is retrying connections adaptively by backing off exponentially at the application layer if an outage lasts for more than a few seconds. Second is discovering services without introducing chatter.
More generally we believe there is an opportunity to amortize polling and environmental awareness efforts across multiple applications by integrating this service into the network architecture. At a minimum such a service must 1) allow an application to detect the environment, 2) allow the application to discover infrastructure services with application level constraints (e.g. closest reachable server, low load), 3) do so securely without leaking sensitive information, and efficiently without extensive polling, and 4) be integrated with the network architecture so applications can rely on the service always being present. We note that such applications do exist today [9, 10], but exist independently and are not integrated into the required framework.
At the same time, it would be useful to develop online applications that can differentiate between different kinds of problems to assist IT in focusing their efforts. Problems such as misconfigurations, failures caused routinely by applications, and failures caused by hosts transitioning between environments must be separated from scanning and malicious activity requiring immediate IT attention.
Altogether we believe that some kinds of waste can and should be reduced, while other waste inherent in the system must be well-documented to make the job of identifying real problems amidst the noise far simpler than it is today.
Traditionally, the collection of traffic traces is done at network aggregation points, backbone links or high volume servers [5, 13, 2] and these provide a brief window into the behavior of a very large number of users. However, it is hard to construct a long term behavioral description of individual endhosts from such traces, particularly so in networks where a significant population is mobile. There are very few endhost traces available, understandably, given the formidable legal and logistical barriers to collect such data. The NETI@Home project is one such endhost based framework [15]; the goal is to use statistics, rather than packet traces, collected from a large collection of endhosts to (centrally) identify end-to-end performance issues. However, the information exported from the endhost is very high level and of limited use. Our own trace is unique in that we collect packet traces from a large population of (mobile) endhosts that move between environments. In previous work, we analyzed these traces and showed that there are significant differences in a number of traffic statistics and features for the same user, as the endhost moves between environments [6]. In this paper, we attempt to quantify the volume of non-useful connections and to associate causes with them.
A large body of work addresses the problem of collecting, and mining, traffic failures to understand failures, though the efforts have focused on specific pieces of the end-to-end puzzle (e.g., web failures in [12, 11]). The work in [12] is somewhat similar in spirit to our own work: packet traces are collected from a number of instrumented endhosts which generate web page requests. It is shown that a third of the failures arise from DNS errors, while the remaining are almost all TCP connection failures, a large fraction of these being server related. In contrast, our work in this paper does not look at web traffic or any other specific applications, but across the suite that are used on the endhosts in our enterprise (of which web traffic is but a small part). While it is very likely that some of the causes identified in [12] play some part in the failures that we observe, our results are broader in scope and the underlying causes we identify have more to do with mobility of the endhost and vagaries of how the endhosts (and applications therein) are configured.
The work that comes closest to what we present in this paper is the study of TCP Resets undertaken by Arlitt and Williamson [3]. A year long campus traffic trace is analyzed and the authors show that a large fraction of TCP connections involve a RST. In particular, the results show that roughly 20-30% of the connections being non-useful (in the sense that is described in this paper). However, the trace that is analyzed misses all the traffic that stays local to the campus and also does not record any UDP traffic. In contrast, our own traces capture all the traffic from the endhosts, including UDP and traffic that is local; we also expect traffic seen on a campus network to be dramatically different in composition from that seen in an enterprise. Furthermore, our goal is to understand root causes at the endhost. The results in [3] indicate that a large fraction of the offending flows are HTTP based, while in our analysis the non-useful flows are distributed over a number of applications. More recently, it was shown that many ISP’s inject TCP RST packets into a client’s stream in order to deliberately throttle certain traffic classes [17]. Since this behavior is not well documented or even well understood, it is very hard to quantify how much of the non-useful flows we can attribute to this behavior.
The fact that many applications and network protocols have evolved independently over the years, combined with shrinking IT staff and budget has led to modern day enterprise networks that embrace high levels of noise. In our study of endhost communication traffic, we find that connection failures are regular, and in some cases, are an integral part of an application. We believe that ignoring this development is short-sighted because of increasing mobility and increasing security threats. In some case, we believe that simple fixes (such as backing off after repeated failures, and building environmental awareness into applications) are available. In other cases, such as redundant service discovery activities, a more careful redesign of network architecture and/or service sharing across applications is needed.
In the future, we would like to use application layer information to enhance our study. This avenue is not without its challenges, as due to user privacy issues, we would have had far fewer volunteers had we retained full packet payloads. We also plan to evaluate our suggested coping strategies in terms of their impact on failure reduction.
We would like to thank the Intel employees who participated in the data collection effort, and Toby Kohlenberg, Stacy Purcell, David Fong, Sanjay Rungta and Manish Dave for insights into enterprise IT operations. We are grateful to our shepherd Joel Sommers, and our anonymous reviewers for providing detailed and helpful feedback on this paper.
This document was translated from LATEX by HEVEA.